
How to Use BirdCast: Migration Forecasts, Live Maps, Alerts and Your County Dashboard, Explained
Every spring and fall, hundreds of millions of birds cross the United States after dark. Most backyard birders sleep through the best of it. BirdCast can change that.
BirdCast is a free tool from the Cornell Lab of Ornithology and its university partners, and it uses the US weather radar network to make a nightly bird forecast. It shows how many birds will move tonight, where they will fly, and which species may show up near you tomorrow.
A five minute check in the evening can tell you a lot. You will know if dawn is worth an early alarm, which feeders to fill, and which new birds to watch for.
This guide walks through each BirdCast tool one by one: the alerts, the forecast maps, the live maps, and the county dashboard. You do not need to be a weather expert to use any of them.
What BirdCast actually is (and what it is not)
BirdCast uses the same weather radars that track storms. At night, those radars also pick up birds in flight. The forecast model learned from 23 years of radar records of bird movement, matched with past weather data.
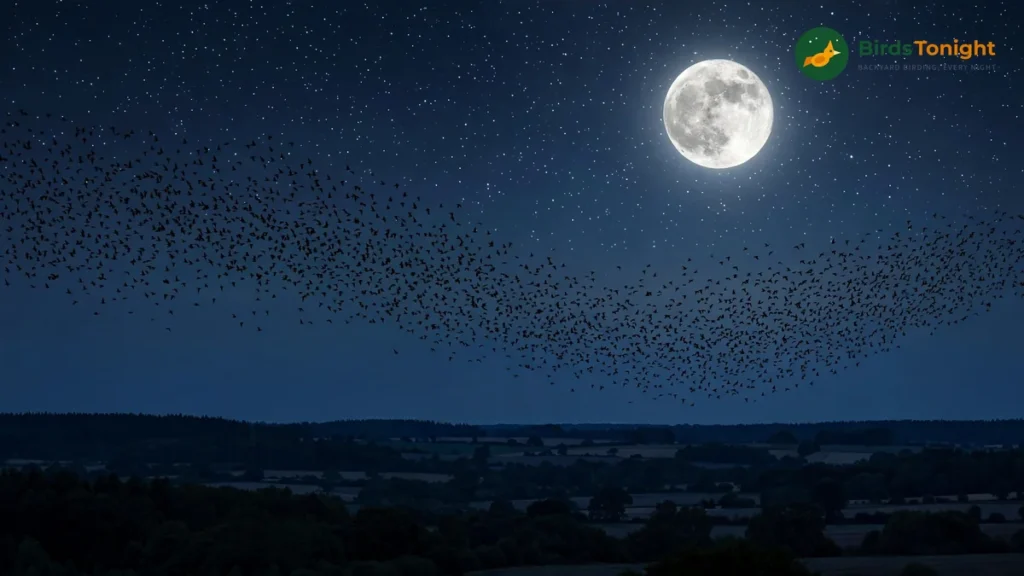
The model now predicts migration much like a weather model predicts rain. It cannot tell you which birds will land in your yard, only how big the flight over your area is likely to be.
Three facts help before you start. First, BirdCast tracks birds in the air, not birds on the ground. A huge forecast over your state means a huge flight overhead, and whether those birds land near you depends on the weather at dawn.
Second, the maps cover the contiguous United States, the Lower 48 states. The BirdCast team notes that Alaska and Hawaii are not in the map graphics. Canadian radar data is not part of the maps yet.
Third, BirdCast is seasonal. The live feed runs from March 1 to June 15 in spring and from August 1 to November 15 in fall. It switches on at local sunset each night and off at sunrise.
Outside those dates, the dashboard has a historical mode that lets you look back at any past migration night. That mode is the best way to practice in winter.
The 5-minute evening routine
You do not need all four tools every night. Most migration watchers use a short routine that takes about five minutes in the evening.
- Check your migration alert (30 seconds). Is tonight Low, Medium, or High for your area?
- Look at the forecast maps (1 minute). Is tonight the best night of the next three, or is a bigger flight coming tomorrow?
- Open your county dashboard (2 minutes). Read the Expected Nocturnal Migrants list so you know which species to look and listen for in the morning.
- Get the yard ready (1 minute). On a High night, fill the feeders, refresh the water, and turn off outdoor lights you do not need.
- Be outside at dawn. Last night’s flight becomes this morning’s backyard birds.
Tool 1: Migration alerts, your yes or no answer for tonight
The migration alerts page gives your area a simple rating for the night ahead: Low, Medium, or High. It is shown in birds per kilometre per night.
The key point is that these levels are local. A High alert means the predicted flight for your area is in the top 10% of migration nights for the season where you live. It is not a comparison with the whole country.
A Medium alert sits in roughly the 70 to 90% band, a night well above average for your area. A Medium night in a quiet inland county can still bring plenty of new birds to your feeders.
Local ratings matter because migration is not a steady stream. BirdCast researchers point out that about 10% of the nights in a season carry about 50% of the season’s total migration traffic. Most of the birds move on a small number of very big nights.
The alerts tell you when one of those big nights is coming. They are also the trigger for Lights Out action. On high intensity nights, turning off outdoor lights lowers the chance of birds being drawn to the light and into collision danger.
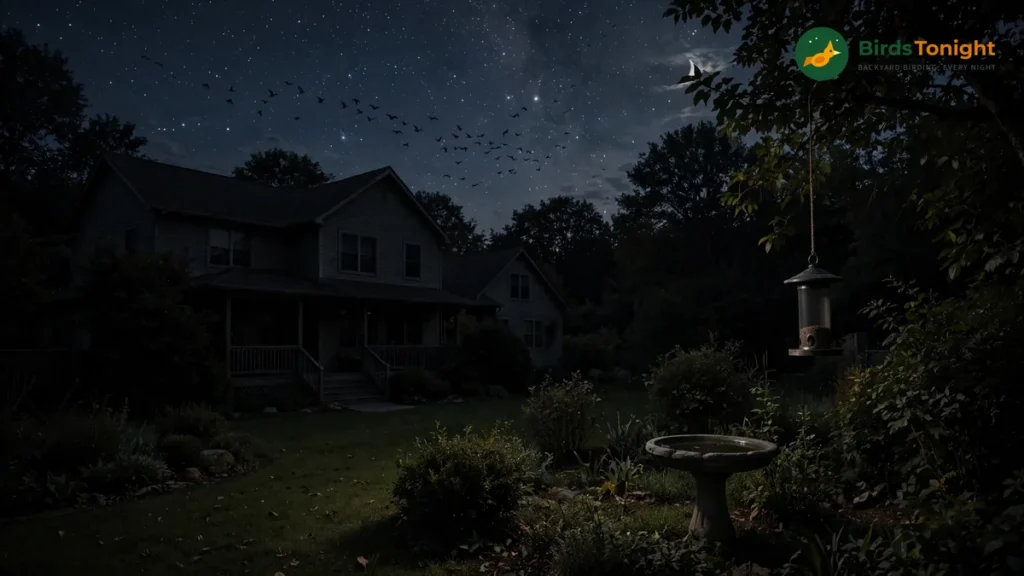
The backyard reading is simple. High means set the alarm, fill everything, and expect new faces at dawn. Medium means a morning look is worth it, and Low means the birds are waiting for better weather, so you can too.
Tool 2: Forecast maps, pick the best night of the next three
The forecast maps show predicted migration for tonight and up to 3 nights ahead, refreshed every 6 hours. Each map shows the expected migration about three hours after local sunset, when the night’s traffic is usually building up.
Warm, bright colours on the maps mean stronger migration. Dim blues mean a quiet night, and oranges and reds mean a major flight.
Areas outlined in grey show expected rain. Rain plus artificial light is confusing and dangerous for night migrants, and a rain front near dawn can push flying birds down to the ground.
When birds drop like that, birders call it a fallout. A fallout can produce some of the best backyard and park birding of the whole season.

Check the maps again in the evening before you decide. The forecasts are rebuilt every 6 hours from the latest weather data. A promising night can get stronger during the day, or it can fall apart.
One caution from BirdCast: the models predict birds in active flight, not bird numbers on the ground. A strong flight on a clear night with helpful winds may pass high over your yard and never stop.
A moderate flight that runs into rain at dawn may drop birds all around you. So read the forecast first, then check your local dawn weather. That pair of checks is what predicts a great backyard morning.
Tool 3: Live maps, watch tonight’s flight as it happens
Once the sun sets in migration season, the live maps show migration across the contiguous US in near real time, fed by the radar network as it detects birds. They update about every 10 minutes between local sunset and sunrise.
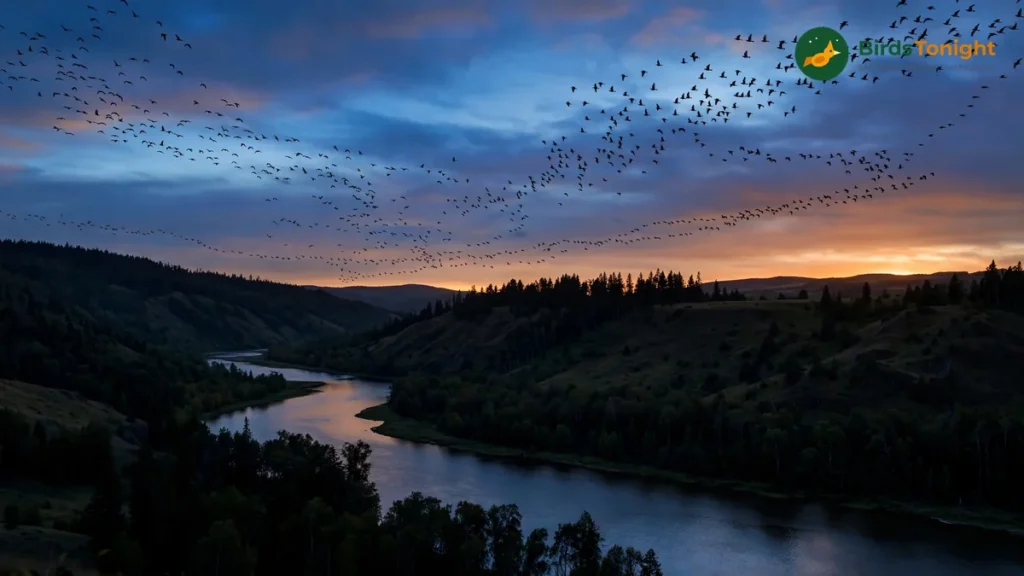
Brightness on the map shows the migration traffic rate. It is measured in birds per kilometre per hour, meaning how many birds cross a line 1 km long in one hour.
Orange arrows show the direction the birds are moving, broadly north in spring and south in fall. Weather bends the flow from night to night, so the arrows do not always point the same way.
The red line moving across the map marks local sunset, and the yellow line marks sunrise. The flight starts just after dark and winds down at first light.
Green and red dots mark radar stations, with and without data available, and gaps do happen. Radars go down for repairs, and coverage is thinner in the mountains because many western radars sit on high peaks.
The live maps are most useful in the first half of the night. Watch a bright stream of migration build over your region after sunset. You can then make a good call on whether dawn will be busy.
One detail catches out western viewers: the map graphics are timed to Eastern Time. If you live further west, shift the animation in your head to match your own sunset.
Tool 4: Your county dashboard, the numbers for your own patch
The migration dashboard is where BirdCast gets personal. Enter your county or state, pick a date, and you get a full report on the night flight over your own area.

Read the panels in this order. Start with Birds Crossed This Night, a running count of the estimated birds that have flown over your area since sunset.
A count like 400,000 birds over your county is the difference between a normal weekday and a dawn chorus full of newcomers. Big numbers mean you should be outside early.
Next is Peak Migration Traffic. It shows how many birds were in the air at the peak moment, plus their average direction, speed, and altitude. Birds generally fly between about 100 and 10,000 feet above the ground, and the panel shows where tonight’s flight sits in that range.
The Birds in Flight chart plots the night’s traffic curve against the past pattern for your area. That past pattern is built from 2013 to 2021 data. At a glance, you can see if last night was normal or special for your county.
The panel backyard birders use most is Expected Nocturnal Migrants, drawn from eBird observation frequencies. It lists the night migrating species most likely to be arriving in or leaving your region this week.
Think of that list as your morning checklist. It names the warblers, thrushes, tanagers, and sparrows to watch for at the feeders and the birdbath. Many birders hear a new bird at dawn before they ever see it, and the list trains your ears.
BirdCast gives two honest warnings about this list. It covers night migrants only, so daytime movers like most hawks and swallows will not appear. In areas with few eBird observers, the list sometimes cannot be made at all.
You can help fix that second gap. Send your own sightings to eBird, and your records help build the data behind the list.
The last panel is Total Birds Crossed, the running total for the season in your area. It climbs fast in peak weeks and gives you a real sense of the river of birds you have been living under.
The dashboard also has an off season strength. Outside the live windows, you can switch it to past dates and replay the biggest nights of last season over your county. That is a good way to learn what a major flight looks like in the charts.
If you are reading this in winter, treat that as your homework. You will arrive at March 1 already able to read every panel, and the first spring forecast goes live that day.
Turning a big night into a big morning
Radar tells you birds are coming. A few habits turn that flight into birds you actually see.

- Feed before dark, not after dawn. On a High alert evening, top up the feeders and clean the birdbath before sunset. Migrants that drop in at first light are hungry and thirsty, and they find stocked yards first.
- Keep it dark on big nights. Switch off porch and garden lighting on High nights. It is the easiest conservation step a homeowner can take in migration season, and the alert system is built around these peak nights.
- Start at first light. New arrivals are most active and most vocal in the first two hours of the day, feeding hard before they move on or settle in.
- Work from the expected migrants list. If the dashboard flags arriving thrushes or the first warblers for your county this week, you know what to listen for. Calls often give a dawn newcomer away before you see it.
- Log what you see. Sightings sent to eBird feed the frequency data that the species lists are built from. Your backyard list improves next season’s lists for your neighbours.
Limitations worth knowing
BirdCast is the best public window on night migration that has ever existed. It is still radar, and radar has blind spots.
- Rain, insects, and low numbers create gaps. Rain muddies the signal, and big insect emergences can confuse it. On very quiet nights, some dashboard figures, such as altitude, cannot be worked out at all.
- Mountains blur the picture. High western radars can miss birds flying below the beam. Treat exact numbers in mountain states as rough, and watch how the numbers change instead.
- A forecast is a forecast. It updates every 6 hours because the weather changes. Treat a forecast three nights out as a planning hint, and the same evening update as the one to act on.
- Day migrants are mostly invisible to it. Hawks, eagles, swallows, and many other daytime travellers do not show up in night radar data. A quiet dashboard does not mean nothing is moving.
FAQ
Is BirdCast free to use?
Yes. The forecasts, live maps, alerts, and dashboards on birdcast.info are free public tools. They come from the Cornell Lab of Ornithology and its partners.
When does BirdCast switch back on in spring?
The live data feed runs from March 1 to June 15 in spring and from August 1 to November 15 in fall, each night from local sunset to sunrise. Past data stays open to browse all year round.
BirdCast says High, but my yard was quiet this morning. Why?
The forecast measures birds in the air, not birds landing. On clear nights with helpful tailwinds, migrants can fly right over your area and land far beyond it. Your best mornings come when a strong flight meets dawn weather, such as rain, a front, or poor winds, that brings birds down near you.
Check the dashboard’s Birds Crossed number next to your local dawn weather each morning. Within a few weeks, you will start to see your own yard’s pattern.
Does BirdCast work outside the US?
The maps and alerts cover the contiguous United States. BirdCast notes that Canadian weather radar data, from 32 radars collecting very similar information, is being studied for future use. It is not part of the tools yet, but birders elsewhere can still use eBird data for their own region.
The one habit that matters
You do not need to master radar or weather science. On migration season evenings, spend five minutes with the alert, the forecast, and your county’s expected migrants list.
BirdCast will show you which few nights each season carry half the migration. Those are the mornings your backyard fills with birds that were not there the day before. The season restarts on March 1, so be ready for it.
Sources
- BirdCast: Forecast Maps: forecast timing (about 3 hours after local sunset), updates every 6 hours, model trained on 23 years of radar data, rain display, and the note that forecasts cover birds in flight, not on the ground
- BirdCast: Live Maps: near real time radar display, migration traffic rate (birds per km per hour), sunset and sunrise lines, radar coverage notes
- BirdCast: Migration Alerts: Low, Medium, and High definitions (High = top 10% of local nights), about 10% of nights carrying about 50% of migration traffic, Lights Out reasons, contiguous US scope
- BirdCast: Your Local Migration Dashboard: panel details (Birds Crossed, Peak Traffic, Expected Nocturnal Migrants from eBird data, altitude range), live feed windows (March 1 to June 15; August 1 to November 15), historical mode
- University of Oxford: Creating a continental bird migration forecast: forecasts up to three days ahead, 143 weather radars, 23 years of spring migration data